Internal infrastructure tooling · Case study · 4 min read
Smart API Monitor
A monitoring service that watches your APIs on a schedule, keeps the history, and tells you the moment something breaks.
Smart API Monitor is a private build. The application runs on AWS with no public demo.
- Client
- Internal infrastructure tooling
- Year
- 2025
- Role
- Full-stack engineer & DevOps
- Duration
- 8 Weeks
- Industry
- DevOps, Infrastructure
- Tools
- Next.js, Express, PostgreSQL, AWS, GitHub Actions
- System design
- Full-stack development
- CI/CD infrastructure
At a glance
Challenge
Knowing an API is down is the easy half. The hard half is knowing it was down at 3am, that it has been flaky for two weeks, and that the p95 crept from 180ms to 900ms after a deploy. Teams end up writing throwaway scripts, then maintaining them, then ignoring them.
Solution
A scheduled monitoring service: it probes registered endpoints on a configurable interval, records status, latency and response metadata into PostgreSQL, surfaces trends on a dashboard, and fires email alerts the moment a check fails or a latency threshold breaks.
Outcome
A production-shaped internal tool with a check scheduler, historical analytics, threshold-based alerting and a full CI/CD pipeline — deployed on AWS, with every change gated by automated tests.
Deliverables
- Scheduled endpoint check runner
- Latency and uptime analytics dashboard
- Email alerting on failure and threshold breach
- Historical metrics store in PostgreSQL
- GitHub Actions CI/CD pipeline to AWS
Overview
Smart API Monitor watches endpoints the way a smoke test watches a release, but continuously and with history. You register an endpoint, choose a schedule and thresholds, and the service takes over the boring part.
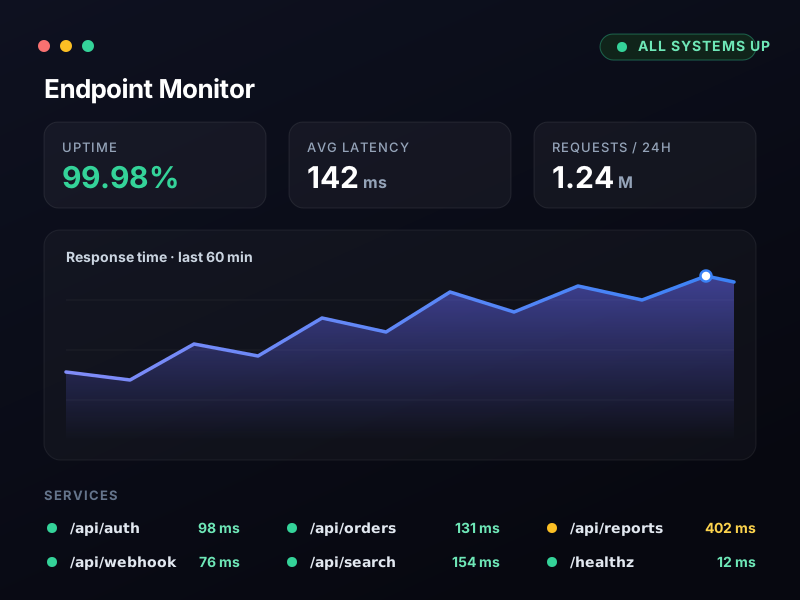
The design work was mostly about signal: a dashboard that separates “is it up” from “is it healthy”, so an on-call engineer sees the difference in one glance.
The challenge
- Probe endpoints on a schedule without a race between checks
- Store enough history to answer “when did it start?”
- Alert on both hard failures and slow degradation
- Keep the dashboard useful at 3am
- Ship continuously without a manual release ritual
Approach
1. Checks are idempotent and isolated
Each check runs as an independent job with its own timeout, its own retry policy and its own record. A hung endpoint can never block the scheduler, and one failed check never corrupts the run.
2. History is the product
Status alone is a notification; history is a diagnosis. Every check stores latency, response time, status code and payload size, which is what turns “the API is slow” into “the API got slow after Tuesday's deploy”.
3. Alerting with a fatigue budget
Alerts are deduplicated per endpoint, and a flapping endpoint gets one message with the flap window rather than forty messages. An alert channel you mute is an alert channel you no longer have.
The solution
A Next.js dashboard over an Express check runner, with PostgreSQL holding the metric history and AWS hosting the whole stack behind a CI/CD pipeline defined in GitHub Actions. Deployments are reproducible from a clean checkout, and the pipeline runs the test suite before anything touches production.
Results
The service is running internally. Checks report on their configured intervals, failures page the right person, and the dashboard shows uptime and latency trends per endpoint over a selectable window.
Key takeaways
Alerting is a design problem before it is an infrastructure problem. A noisy monitor is a monitor people mute, and a muted monitor is worse than no monitor because it still feels covered.
Keeping the history is what turns monitoring into understanding. Without it you know things are broken; with it, you know when they broke and what changed.
We stopped asking each other whether the API was down. The monitor tells us, tells the on-call, and keeps the history so the post-mortem starts with answers instead of guesses.
FAQ
What does it monitor?
Registered HTTP endpoints, probed on a per-endpoint schedule with configurable timeouts, retries and latency thresholds. Failed or slow checks trigger email alerts.
How long is the history kept?
Check records — status, latency, response size and timing — are written to PostgreSQL on every run, so trends are available per endpoint over a selectable window.
How is it deployed?
Through a GitHub Actions pipeline that runs the test suite and deploys to AWS, so every release is reproducible and nothing reaches production unverified.
Have a project in mind?
I design and build production websites, platforms and documentation — from the first wireframe to a live deployment.
FlavorFit
Explore case study